Ichimoku Kinkou Hyou (Itchy Mushrooms)
Re: TA Exchange: Ichimoku Kinko Hyo (Itchy Mushrooms)
Yes, this is the Huat-indicator that market is quiet.
1. Always wait for the setup. NO SETUP; NO TRADE
2. The trend will END but I don't know WHEN.
TA and Options stuffs on InvestIdeas:
The Ichimoku Thread | Option Strategies Thread | Japanese Candlesticks Thread
2. The trend will END but I don't know WHEN.
TA and Options stuffs on InvestIdeas:
The Ichimoku Thread | Option Strategies Thread | Japanese Candlesticks Thread
-

iam802 - Big Boss
- Posts: 5940
- Joined: Wed May 07, 2008 1:14 am
Re: TA Exchange: Ichimoku Kinko Hyo (Itchy Mushrooms)
better clarify:
the 'stars' are the huat-indicator of quiet market not GR reading on 'mushroom' stuffs.
Else, my accnt will be deleted.
the 'stars' are the huat-indicator of quiet market not GR reading on 'mushroom' stuffs.
Else, my accnt will be deleted.
1. Always wait for the setup. NO SETUP; NO TRADE
2. The trend will END but I don't know WHEN.
TA and Options stuffs on InvestIdeas:
The Ichimoku Thread | Option Strategies Thread | Japanese Candlesticks Thread
2. The trend will END but I don't know WHEN.
TA and Options stuffs on InvestIdeas:
The Ichimoku Thread | Option Strategies Thread | Japanese Candlesticks Thread
-

iam802 - Big Boss
- Posts: 5940
- Joined: Wed May 07, 2008 1:14 am
Re: TA Exchange: Ichimoku Kinko Hyo (Itchy Mushrooms)
i think,,,,it is safe to go for a beer.... 
Options Strategies & Discussions  .(Trading Discipline : The Science of Constantly Acting on Knowledge Consistently - kennynah).
 Investment Strategies & Ideas
 ..................................................................<A fool gives full vent to his anger, but a wise man keeps himself under control-Proverbs 29:11>.................................................................
-

kennynah - Lord of the Lew Lian
- Posts: 14201
- Joined: Wed May 07, 2008 2:00 am
- Location: everywhere.. and nowhere..
Re: TA Exchange: Ichimoku Kinko Hyo (Itchy Mushrooms)
I just saw some of the 'mushroom' indicators on ChartNexus.
Will see how it looks like compare to the ang-moh moving average etc.
Will see how it looks like compare to the ang-moh moving average etc.
1. Always wait for the setup. NO SETUP; NO TRADE
2. The trend will END but I don't know WHEN.
TA and Options stuffs on InvestIdeas:
The Ichimoku Thread | Option Strategies Thread | Japanese Candlesticks Thread
2. The trend will END but I don't know WHEN.
TA and Options stuffs on InvestIdeas:
The Ichimoku Thread | Option Strategies Thread | Japanese Candlesticks Thread
-

iam802 - Big Boss
- Posts: 5940
- Joined: Wed May 07, 2008 1:14 am
Re: TA Exchange: Ichimoku Kinko Hyo (Itchy Mushrooms)
ok....GR and you can become solid at this indicator..then teach me, ok.... i serve drinks...hahaha...like pay for lessons like dat...
Options Strategies & Discussions  .(Trading Discipline : The Science of Constantly Acting on Knowledge Consistently - kennynah).
 Investment Strategies & Ideas
 ..................................................................<A fool gives full vent to his anger, but a wise man keeps himself under control-Proverbs 29:11>.................................................................
-

kennynah - Lord of the Lew Lian
- Posts: 14201
- Joined: Wed May 07, 2008 2:00 am
- Location: everywhere.. and nowhere..
Re: TA Exchange: Ichimoku Kinko Hyo (Itchy Mushrooms)
iam802 wrote:I just saw some of the 'mushroom' indicators on ChartNexus.
Will see how it looks like compare to the ang-moh moving average etc.
Note that the ChartNexus IKH lacks the trailing Chikou Span (price action shifted back 26 periods). This is a crucial indicator for confirmations, so ChartNexus kinda' dropped the ball here. I've written to them to ask them about putting that in. Until then, for confirmation, you'll have to take the current price, and project it back 26 periods to see its relative position to the price back then. Also, ChartNexus doesn't use different colour codes for the kumo clouds (depends on whether Senkou Span A or B is on top, the cloud colour should be different, to show the bullish / bearish sentiments). Again, I've written to them so hopefully they'll put it in.
Last but not least, ChartNexus' Kijun-sen line (the slower line) is blue, and the Tenkan-sen (faster line) line is red. This colouring system is inverted in Stockcharts, unfortunately. So if using both, you'll need to adjust mentally (reason for using both: StockCharts is complete but too small; ChartNexus size is good but lacks the Chikou line and kumo colours). Sianz.
- blid2def
- Permanent Loafer
- Posts: 2304
- Joined: Tue May 06, 2008 7:03 pm
Re: TA Exchange: Ichimoku Kinkou Hyou (Itchy Mushrooms)
GR,
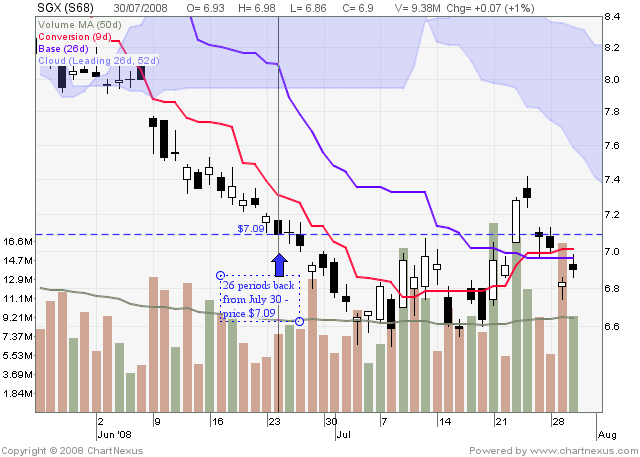
if we just use the price from 26 periods back as a reference..is it accurate enough?
eg.

if we just use the price from 26 periods back as a reference..is it accurate enough?
eg.

1. Always wait for the setup. NO SETUP; NO TRADE
2. The trend will END but I don't know WHEN.
TA and Options stuffs on InvestIdeas:
The Ichimoku Thread | Option Strategies Thread | Japanese Candlesticks Thread
2. The trend will END but I don't know WHEN.
TA and Options stuffs on InvestIdeas:
The Ichimoku Thread | Option Strategies Thread | Japanese Candlesticks Thread
-

iam802 - Big Boss
- Posts: 5940
- Joined: Wed May 07, 2008 1:14 am
Re: TA Exchange: Ichimoku Kinkou Hyou (Itchy Mushrooms)
802, I assume you're talking about compensating for the lack of the Chikou Span in the ChartNexus platform.
If so, your counting is correct. Then you take today's closing price and compare it to that closing price. Same as this (from the kumo trader site):

The Chikou Span is used mainly for confirmation of another signal, but the strategy page does list using a Chikou Span cross as a possible strategy (one of five). I've never relied solely on that though, but maybe it's something I should take a closer look at, now that you ask.
A bit more...
The conventional support/resistance lines are simply defined by sharp points in historical price action (i.e. Chikou Span). These tend to vary in strength; but from what I've seen, the peaks, troughs and points with multiple touches tend to be stronger.
The unconventional support/resistance lines are actually provided by so-called "kumo shadows". These are the flat regions in the kumo clouds in the past. Right now, I tend to lean toward using "kumo shadows" to mark my major SR lines.
This is a chart of S&P500 with some of the SRs added - the horizontal, red dashed lines represent SRs formed by the "kumo" shadows; the blue ones are SRs formed by the Chikou Span (historical price action).
http://stockcharts.com/h-sc/ui?s=$SPX&p ... =146304750
I'm still learning new things about the Itchy Mushroom as I put it to practice (e.g. the kumo clouds, kumo shadows); so if there are experienced mushroom farmers out there, please help fertilize my brain.
If so, your counting is correct. Then you take today's closing price and compare it to that closing price. Same as this (from the kumo trader site):

The Chikou Span is used mainly for confirmation of another signal, but the strategy page does list using a Chikou Span cross as a possible strategy (one of five). I've never relied solely on that though, but maybe it's something I should take a closer look at, now that you ask.
A bit more...
The conventional support/resistance lines are simply defined by sharp points in historical price action (i.e. Chikou Span). These tend to vary in strength; but from what I've seen, the peaks, troughs and points with multiple touches tend to be stronger.
The unconventional support/resistance lines are actually provided by so-called "kumo shadows". These are the flat regions in the kumo clouds in the past. Right now, I tend to lean toward using "kumo shadows" to mark my major SR lines.
This is a chart of S&P500 with some of the SRs added - the horizontal, red dashed lines represent SRs formed by the "kumo" shadows; the blue ones are SRs formed by the Chikou Span (historical price action).
http://stockcharts.com/h-sc/ui?s=$SPX&p ... =146304750
I'm still learning new things about the Itchy Mushroom as I put it to practice (e.g. the kumo clouds, kumo shadows); so if there are experienced mushroom farmers out there, please help fertilize my brain.
- blid2def
- Permanent Loafer
- Posts: 2304
- Joined: Tue May 06, 2008 7:03 pm
Re: TA Exchange: Ichimoku Kinkou Hyou (Itchy Mushrooms)
yo Grandrake,
this kong fu is extremely useful, please con't writing!!
thanks in advance.
this kong fu is extremely useful, please con't writing!!
thanks in advance.
- helios
- Permanent Loafer
- Posts: 3527
- Joined: Wed May 07, 2008 8:30 am
Re: TA Exchange: Ichimoku Kinkou Hyou (Itchy Mushrooms)
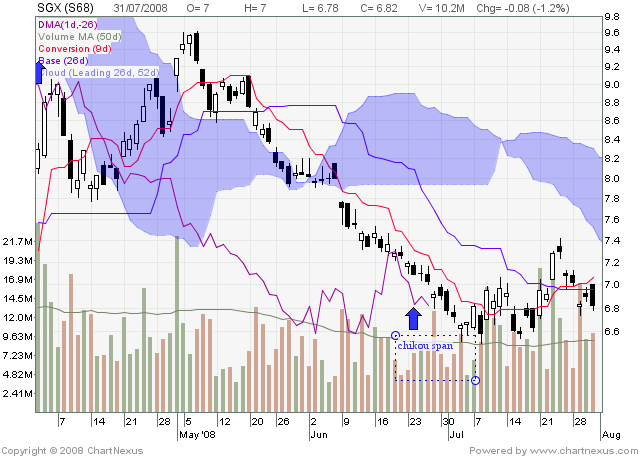
The folks at ChartNexus have show me how to get the 'price from 26 periods back'.
1. Indicators
- Select 'Displaced Moving Average'
- Click Edit
- Change Period to 1
- Change Displacement to -26

1. Indicators
- Select 'Displaced Moving Average'
- Click Edit
- Change Period to 1
- Change Displacement to -26

1. Always wait for the setup. NO SETUP; NO TRADE
2. The trend will END but I don't know WHEN.
TA and Options stuffs on InvestIdeas:
The Ichimoku Thread | Option Strategies Thread | Japanese Candlesticks Thread
2. The trend will END but I don't know WHEN.
TA and Options stuffs on InvestIdeas:
The Ichimoku Thread | Option Strategies Thread | Japanese Candlesticks Thread
-

iam802 - Big Boss
- Posts: 5940
- Joined: Wed May 07, 2008 1:14 am
Return to Other Investment Instruments & Ideas
Who is online
Users browsing this forum: No registered users and 8 guests
