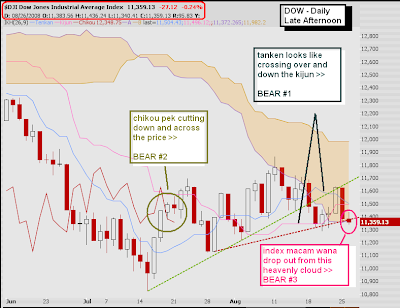
K, the bearish price-Kijun cross, bearish Tenkan-Kijun impending-cross, and the bearish Chikou Span confirmation cross - all identified correctly. The impending bearish cloud exit is identified correctly as well.
Just looking at this picture alone, you can step back to look at it and summarize it as:
bearish trend -> temporary break from fall -> trendless state ->
potential continuation of bearish trend
Whether the continuation happens, will depend on how strong the supports below the cloud hold up. The other thing I'd look for, is for the Tenkan and Kijun lines to: (1) angle downwards and (2) leave the cloud as well.
The current base of the cloud is actually the Senkou A (this is a bearish cloud - the Senkou A and B spans have reversed positions). Recall that the Senkou A is formed by taking the average of the Tenkan and Kijun sens from 26 periods back. Since the current Tenkan and Kijun sens are still higher than the Senkou A, it means that we've still not undercut the brief relief period (26 periods back). Eh... dunno if I make sense?


