Investment Myths Busted

Re: Investment Myths Busted

Postby blid2def » Tue Jul 22, 2008 4:34 pm

MM, you mentioned that:

"NOT ALL FOLLOW THRO' DAY results in a major uptrend BUT NO RALLY IN HISTORY HAS EVER STARTED WITHOUT A POWERFUL FOLLOW THRO' DAY."

Just a quick check with you - don't have to dig for this info if you don't have it handy:
- Do you have info on some of those times in the past few years where there was a follow-through day but a rally failed to result?

Was thinking of using that to backtest a system. No worries if you don't have that info available. :)
blid2def
Permanent Loafer
 
Posts: 2304
Joined: Tue May 06, 2008 7:03 pm

Re: Investment Myths Busted

Postby millionairemind » Tue Jul 22, 2008 4:51 pm

Try follow thro' days on Jun 29 2006 (Day 12 of Attempt Rally) and Feb 13 2008 (this was a darn weak follow thro', more than 15 days passed..). There are a couple other days but I cannot seem to remember them now.

If you find any lobangs, PM me brudder.. :mrgreen: :mrgreen:
"If a speculator is correct half of the time, he is hitting a good average. Even being right 3 or 4 times out of 10 should yield a person a fortune if he has the sense to cut his losses quickly on the ventures where he has been wrong" - Bernard Baruch

Disclaimer - The author may at times own some of the stocks mentioned in this forum. All discussions are NOT to be construed as buy/sell recommendations. Readers are advised to do their own research and analysis.
User avatar
millionairemind
Big Boss
 
Posts: 7776
Joined: Wed May 07, 2008 8:50 am
Location: The Matrix

Re: Investment Myths Busted

Postby iam802 » Tue Jul 22, 2008 5:14 pm

a bit free today... so, I use SGX as an example.

what I have done is take the above listed correction or distribution days and follow through days to do some trades.

Assume start out 1000 shares on SGX.

Image
1. Always wait for the setup. NO SETUP; NO TRADE

2. The trend will END but I don't know WHEN.

TA and Options stuffs on InvestIdeas:
The Ichimoku Thread | Option Strategies Thread | Japanese Candlesticks Thread
User avatar
iam802
Big Boss
 
Posts: 5940
Joined: Wed May 07, 2008 1:14 am

Re: Investment Myths Busted

Postby kennynah » Tue Jul 22, 2008 5:25 pm

802 : so accordingly, as shown in your SGX chart, that last trading day shows huge volume on a upticked price, so, this constitutes a #1 Rally Attempt, tio boh? so, now, need to wait and see the evolution of #2, #3, #4...etc rallies in the next 10 or so days, and if they appear, that's a confirmation of an uptrend, tio boh?
if so, price would have already run up so much, it would have been obvious, wouldn't it?
just querying, bcos i have many times, stated that I just cannot understand O'Neil's method...so, i want to learn...and the way i learn is to ask the silliest of questions, hence, i seek your patience....

many arigatoes...
Options Strategies & Discussions .(Trading Discipline : The Science of Constantly Acting on Knowledge Consistently - kennynah).Investment Strategies & Ideas

Image..................................................................<A fool gives full vent to his anger, but a wise man keeps himself under control-Proverbs 29:11>.................................................................Image
User avatar
kennynah
Lord of the Lew Lian
 
Posts: 14201
Joined: Wed May 07, 2008 2:00 am
Location: everywhere.. and nowhere..

Re: Investment Myths Busted

Postby iam802 » Tue Jul 22, 2008 8:20 pm

Unfortunately, we can't just look at SGX chart alone.

Why?

Because STI follows the US market. So, to see if one can buy SGX now (or tomorrow), look at DOW, NASDAQ.

On price run up. When price runs up, investors/traders will be asking themselves, "Is it too high now? Will it crash ? Especially in current market conditions where no one knows about the subprime impact.

So, I am assuming the 'follow-thru' are market signals from the BB. If BB, is going in at this level, they can't run as fast as we do, because we are more nimble. So, the possibility of BB pulling out the very next day is relatively lower.

Does that make sense?

I think this is the first time I am thinking through this as well. So, maybe it does not make sense.

Maybe others can chip in and share their opinions.
1. Always wait for the setup. NO SETUP; NO TRADE

2. The trend will END but I don't know WHEN.

TA and Options stuffs on InvestIdeas:
The Ichimoku Thread | Option Strategies Thread | Japanese Candlesticks Thread
User avatar
iam802
Big Boss
 
Posts: 5940
Joined: Wed May 07, 2008 1:14 am

Re: Investment Myths Busted

Postby kennynah » Tue Jul 22, 2008 8:34 pm

802 : kam sia for this response.

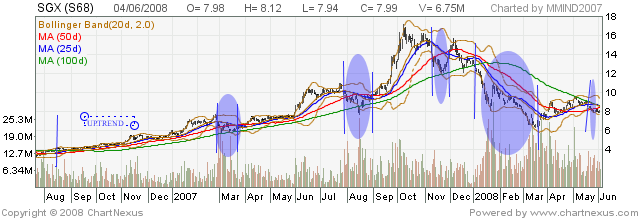
iam802 wrote:Unfortunately, we can't just look at SGX chart alone.
Why?
Because STI follows the US market. So, to see if one can buy SGX now (or tomorrow), look at DOW, NASDAQ.


i also duno, except that if this SGX chart by itself thru using O'Neil's method, cannot give direction to trade/invest, but have to be reliant on US indexes, then why look at it? wouldn't it be more meaningful then just to look at US based indexes, or SGX equivalent related sector, and then decide the next morning if SGX should be bought, sold or ignored?
If so, is O'Neil methodology applicable to some markets, some counters, some assets but not all?
I duno...

iam802 wrote:On price run up. When price runs up, investors/traders will be asking themselves, "Is it too high now? Will it crash ? Especially in current market conditions where no one knows about the subprime impact.

So, I am assuming the 'follow-thru' are market signals from the BB. If BB, is going in at this level, they can't run as fast as we do, because we are more nimble. So, the possibility of BB pulling out the very next day is relatively lower.

Does that make sense?

I think this is the first time I am thinking through this as well. So, maybe it does not make sense.

Maybe others can chip in and share their opinions.


thanks again boss...but sorry, i also duno....

in fact, i duno much about O'Neil's method that it puzzles me, despite MM having given me a private session before and having read several of ON's writings... what i dont know, bothers me and i am adamant in discovering more... I am certain this method works under certain circumstance...after all, a person called William O'Neil is prove...

ON gurus, please teach me... thanks.
Options Strategies & Discussions .(Trading Discipline : The Science of Constantly Acting on Knowledge Consistently - kennynah).Investment Strategies & Ideas

Image..................................................................<A fool gives full vent to his anger, but a wise man keeps himself under control-Proverbs 29:11>.................................................................Image
User avatar
kennynah
Lord of the Lew Lian
 
Posts: 14201
Joined: Wed May 07, 2008 2:00 am
Location: everywhere.. and nowhere..

Re: Investment Myths Busted

Postby millionairemind » Tue Jul 22, 2008 8:57 pm

Here is a chart for SGX for the last few uptrends and corrections... just to illustrate what I mean by timing the market and understand market trend when you enter a position in Singapore.

Image

The sections highlighted in blue are the corrections (downtrends)...there was a brief uptrend in Feb 13 2008 which was quickly met by a major selloff the next day... this kind of uptrend cannot persist and a CANSLIM follower would have covered the next day.

Here are the dates and the prices when the position is entered or exited.

Date Entered Price Entered Date Exited Price Exited Profit/Loss
Aug 15 2006 3.90 Feb 28 2007 6.80 +2.90
Mar 22 2007 6.40 Jul 27 2007 10.10 +3.70
Aug 30 2007 9.35 Nov 09 2007 14.30 +4.95
Nov 29 2007 13.50 Jan 04 2008 12.70 -0.80
Mar 24 2008 6.90 May 22 2008 8.50 +1.60
Current price $6.92
Total gain if buy and hold from Aug 06 till now $3.02 = 77%
Total gain if buy and sell according to mkt conditions = $12.35 = 317%.

This is just for illustration purposes for the CANSLIM methodology applied to Singapore market and for further discussion... As you can see.. CANSLIM is not about buying at the bottom or selling at the top.. it is buying when mkt trend is with you and selling when it is not.

I am not against any method of investing...it has always been the practitioner, not the method that separates the winners. You can use the dates above and look at your own stocks to see if it makes you more money this way.
"If a speculator is correct half of the time, he is hitting a good average. Even being right 3 or 4 times out of 10 should yield a person a fortune if he has the sense to cut his losses quickly on the ventures where he has been wrong" - Bernard Baruch

Disclaimer - The author may at times own some of the stocks mentioned in this forum. All discussions are NOT to be construed as buy/sell recommendations. Readers are advised to do their own research and analysis.
User avatar
millionairemind
Big Boss
 
Posts: 7776
Joined: Wed May 07, 2008 8:50 am
Location: The Matrix

Re: Investment Myths Busted

Postby kennynah » Tue Jul 22, 2008 8:59 pm

mm :many thanks....but i need to use magnifying glasses....sorry...cant see...hahaha....you got a bigger chart with all the ang kong drawn? i suspect, i am getting a good education here... thanks bro...!!!
Options Strategies & Discussions .(Trading Discipline : The Science of Constantly Acting on Knowledge Consistently - kennynah).Investment Strategies & Ideas

Image..................................................................<A fool gives full vent to his anger, but a wise man keeps himself under control-Proverbs 29:11>.................................................................Image
User avatar
kennynah
Lord of the Lew Lian
 
Posts: 14201
Joined: Wed May 07, 2008 2:00 am
Location: everywhere.. and nowhere..

Re: Investment Myths Busted

Postby millionairemind » Tue Jul 22, 2008 9:17 pm

K - very paiseh.. the chart from Chartnexus is very small.. cos' it is a 3 year chart....and machiam free lah... I am cheapo... like free things on the internet to help me invest/trade. :D

Me not qualified to teach you Da Ge... just sharing what little I know about CANSLIM after practising it for a few years.

The dates entered are when there is a follow thro' day in the prior night in the US markets and the dates exited are when the US mkts broke down (entered correction).

Here are the dates and the prices when the position is entered or exited with profit and loss for each entry/exit.

Date Entered Price Entered Date Exited Price Exited Profit/Loss
Aug 15 2006 3.90 Feb 28 2007 6.80 +2.90
Mar 22 2007 6.40 Jul 27 2007 10.10 +3.70
Aug 30 2007 9.35 Nov 09 2007 14.30 +4.95
Nov 29 2007 13.50 Jan 04 2008 12.70 -0.80
Mar 24 2008 6.90 May 22 2008 8.50 +1.60


sorly - don't seem to be able to do tab spacing here ;(

Current price $6.92
Total gain if buy and hold from Aug 06 till now $3.02 = 77%
Total gain if buy and sell according to mkt conditions = $12.35 = 317%.

Hope this helps.
Last edited by millionairemind on Tue Jul 22, 2008 9:20 pm, edited 1 time in total.
"If a speculator is correct half of the time, he is hitting a good average. Even being right 3 or 4 times out of 10 should yield a person a fortune if he has the sense to cut his losses quickly on the ventures where he has been wrong" - Bernard Baruch

Disclaimer - The author may at times own some of the stocks mentioned in this forum. All discussions are NOT to be construed as buy/sell recommendations. Readers are advised to do their own research and analysis.
User avatar
millionairemind
Big Boss
 
Posts: 7776
Joined: Wed May 07, 2008 8:50 am
Location: The Matrix

Re: Investment Myths Busted

Postby kennynah » Tue Jul 22, 2008 9:19 pm

hahahaha..... wah liao....i can see the dates/price part....hahahaha...the chart i cant see clearly...ok, no worries, i map it against some charts that show SGX somewhere...thanks boss... :!:
Options Strategies & Discussions .(Trading Discipline : The Science of Constantly Acting on Knowledge Consistently - kennynah).Investment Strategies & Ideas

Image..................................................................<A fool gives full vent to his anger, but a wise man keeps himself under control-Proverbs 29:11>.................................................................Image
User avatar
kennynah
Lord of the Lew Lian
 
Posts: 14201
Joined: Wed May 07, 2008 2:00 am
Location: everywhere.. and nowhere..

PreviousNext

Return to Other Investment Instruments & Ideas

Who is online

Users browsing this forum: No registered users and 2 guests

cron