Hehe, for this case, I post unconventional TA indicators (mushrooms) but I use conventional TA indicators as guide. Hahahhaa...
My thinking at first glance was:
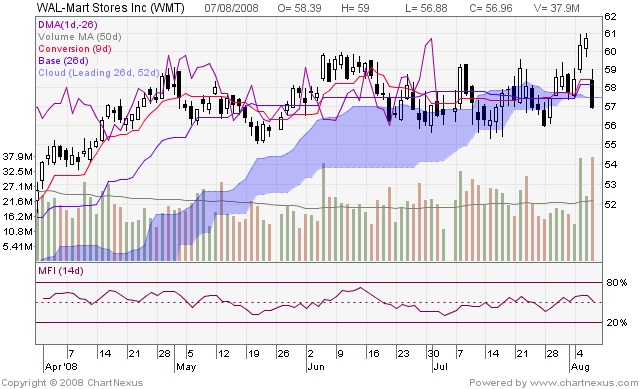
Conventional TA:1. Wahlao, rectangle! Rectangle = 大好大å (surge or tank). Either side can breakout... notice it broke out 3 sessions ago, then last night bend back, together with the general market.
2. The price is sitting on a 9-month support trend line.
3. Ranged trading from 56 - 59 until it breaks out of the rectangle. Which way? Anybody's guess.
Mushroom:I find this sort of charts one of the hardest to determine.
1. The Kijun-sen (red) is flat - and has been flat for a long time - since beginning of June. If you recall from the IKH website, a flat Kijun-sen represents equilibrium, and stock prices tend to seek equilibrium. Next, the Kijun-sen also has a "rubber band" effect on prices, which means that upon reaching equilibrium, prices will bounce off (either up or down).
2. We have a strong resistance line at 59.80 and a strong support line at 55.80. The result is that the price hits one end, comes back to equilibirum, bounces, hits another end, comes back... end up - matching the rectangle chart pattern in conventional TA.
3. From end Jun to end Jul, the price spent a fair bit of time in the kumo cloud - a region of "directionless-ness". It is generally regarded as unsafe (theory lah haha) to trade when prices are in the cloud.
So how???In situations like these (and in most situations when I use IKH anyway), I turn to the weekly chart for guidance:
http://stockcharts.com/h-sc/ui?s=WMT&p= ... =146622551Here now, we can see the bullish crossover and subsequent confirmation back in early 08. Other than that though - no new clues also... So, I go further out... look at monthly chart (hahaha yeah a bit ridiculous liao):
http://stockcharts.com/h-sc/ui?s=WMT&id ... istNum=21#Again, see the nice crossover and confirmation in Jan 08. But not anymore clues though.
Eh... means????So, what's the conclusion? I won't trade it now, but I'd pay attention to what happens in the next few days / weeks. In this particular case, IKH might not be able to give a good guide on the trend - the support/resistance lines are still good. So, may need to rely on conventional TA a bit. There was an abnormally larger no. of 60 CALLS (I think Jan 09 CALLS) being traded a few nights back though.
Gut-feel? Dunno which direction. Hahaha... but I feel that the rectangle is very powerful. There were a couple of recent examples I found; I forgot one of them, but here's one:
FPL:
http://stockcharts.com/h-sc/ui?s=FPL&p= ... =146350696EDIT: And before anyone asks... as usual, I spot a few stocks, and pick and trade the wrong ones. Hahahahaha... KNN head bang wall.