Watch the volume and the kumo resistance
==
It’s been quite some time since my last ARE trade; a trade that I cut-loss.
I am not sure what caught my eyes today. Subconsciously, my mind was telling me to take a look at ARE again.
An interesting development on the Ichimoku charts.
On the Weekly Chart, I can see that ARE has hit the kumo’s wall; a very thick wall and a representation that resistance is strong moving forward. And with that it turns.
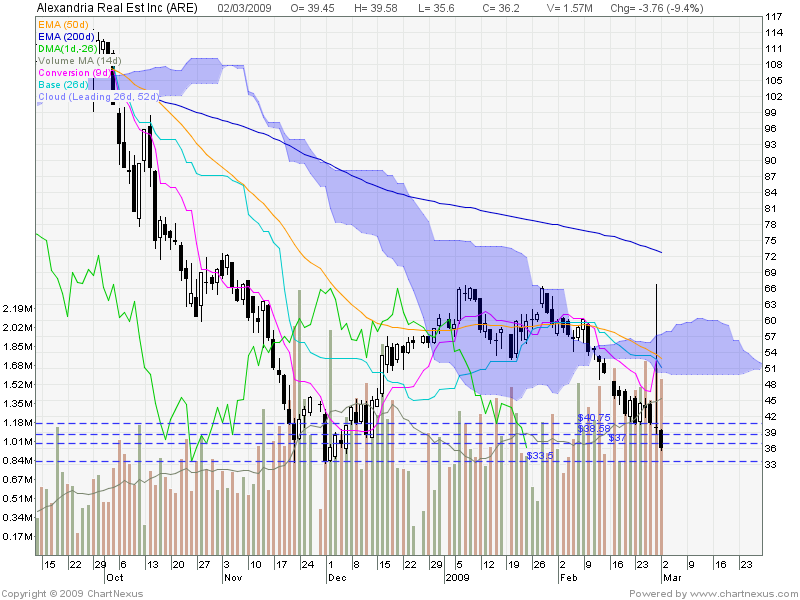
While it is normal for price to fluctuate and trade within range, what caught my eyes were the price action on the Daily Chart.
On the Daily Chart, we can see that there is some kind of sell off on September 24 which results in the price gapping down on opening. This year alone, there are 5 such sell offs (with volume more than 4.7M).
March 19
March 20
April 21
April 22
Sept 24
From a technical analysis point of view, we can deduce the following:
The current uptrend has been broken
We may see a period of price consolidation
It is still too early to say if the downtrend has started
Ichimoku Weekly Chart suggest heavy resistance and price is entering the Weekly kumo (a period of trendless state)